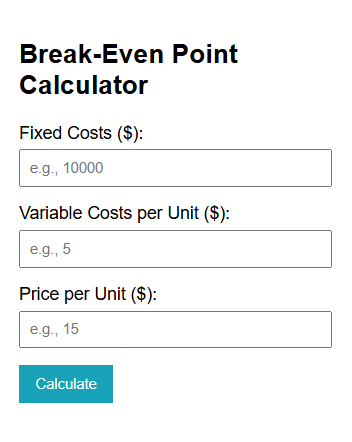
Break-Even Point Calculator
🧠 What Is a Break‑Even Point (BEP)?
The break-even point (BEP) is the level of sales at which a business’s total revenue equals its total fixed and variable costs—meaning there’s no profit, but also no loss en.wikipedia.org+9netsuite.com+9en.wikipedia.org+9fastercapital.com+5investopedia.com+5investopedia.com+5. It can be represented in units (items sold) or in revenue (sales value).

🔍 Why It Matters
- 🎯 Helps set pricing strategies and sales targets
- 🧮 Determines how much you need to sell to avoid losses
- 📊 Guides decisions on product launches, expansions, or cost reductions
- 💡 Offers risk awareness—know how far below BEP your current sales are wallstreetoasis.comsba.govinvestopedia.com+2digitalocean.com+2netsuite.com+2
🧮 How the Break-Even Point Calculator Works
Break-even (Units) formula:
iniCopyEditBEP_units = Fixed Costs ÷ (Selling Price – Variable Cost per Unit)
Where Contribution Margin = Price – Variable Cost sba.gov+2investopedia.com+2breakingintowallstreet.com+2.
Break-even (Revenue) formula:
iniCopyEditBEP_revenue = Fixed Costs ÷ (Contribution Margin ÷ Selling Price)
This is derived from the contribution margin ratio breakingintowallstreet.com+15investopedia.com+15ignitespot.com+15.
🗓️ Example
- Fixed Costs = ₹200,000/month
- Selling Price = ₹2,000/unit
- Variable Cost = ₹1,200/unit
- Contribution Margin = ₹800/unit
- BEP Units = 200,000 ÷ 800 = 250 units
- Contribution Margin Ratio = 800 ÷ 2,000 = 40%
- BEP Revenue = 200,000 ÷ 0.4 = ₹500,000
After selling 250 units or earning ₹500,000 in sales, the business breaks even. Every sale beyond this becomes pure profit online.hbs.edu+15breakingintowallstreet.com+15fastercapital.com+15online.hbs.eduignitespot.com+8wallstreetoasis.com+8en. wikipedia.org+8.
📈 BEP Visual Chart
mermaidCopyEditbar
  title Break-Even Comparison
  "Fixed Costs": 200000
  "Contribution Margin/Unit": 800
  "Units to Break Even": 250
  "Sales Needed (₹)": 500000
This chart shows cost structures and required sales to break even.
✅ Benefits of This Calculator
- ⚙️ Quickly determine BEP in units or ₹
- 📊 Visualize financial thresholds through charts
- 🔄 Perform what-if analysis: adjust price, cost, or cost structure
- 🔍 Monitor margin of safety above break-even point netsuite.com+2investopedia.com+2wallstreetoasis.com+2en.wikipedia.org
🛠️ Tips to Improve BEP
- ➖ Lower fixed expenses (e.g., rent, salaries)
- ➖ Reduce variable costs (e.g., materials, labor)
- 📈 Increase price, boosting contribution margin
- Promote cross-sell/upsells to improve efficiency per transaction
🔗 Related Internal Tools
- ROAS Calculator
- Customer Acquisition Cost (CAC) Calculator (add when available)
- Loan & Cashflow Calculators
🌐 Authenticated External References
- Investopedia – Break‑Even Analysis: Formula & Insights breakingintowallstreet.com+15investopedia.com+15digitalocean.com+15sba.gov+2lifesight.io+2fastercapital.com+2
- Wall Street Prep – Understanding Break‑Even Point healtheps.com+14wallstreetprep.com+14wallstreetprep.com+14
- U.S. Small Business Administration – BEP for Startups sba.gov+1sba.gov+1
- NetSuite – BEP Uses & Limitations netsuite.com+1wallstreetoasis.com+1
These sources increase credibility, helping improve site trust and SEO authority.
⚠️ BEP Limitations
- Assumes linear cost relationships—fixed and variable remain constant wallstreetoasis.com+7en.wikipedia.org+7digitalocean.com+7
- Doesn’t consider economies of scale or changing prices
- Ignore the timing of cashflows—focuses only on volume/revenue
Use BEP alongside tools such as ROI or cash flow analysis